The Reports tab lets you easily track your production efforts and the performance of your content all in one place.
Table of contents :
Why is it important to monitor performance gains?
How is the Reports tab organized?
|
Free trial |
Custom Legacy |
Basic |
Business |
Unlimited |
|
✅ |
✅ |
✅ |
✅ |
✅ |
Why is it important to monitor performance gains?
Monitoring performance gains is an essential part of any SEO strategy, for a number of reasons:
Valuing the work and commitment of your editorial team.
Implement a continuous improvement approach by analyzing and understanding what worked and what didn't.
Identify good and bad practices, re-challenge your objectives and reorient your overall strategy.
Calculate return on investment by comparing the cost of editorial effort with the traffic and leads generated.
How is the Reports tab organized?
The different tabs
Semji divides Reports into three distinct views
- All contents view
- New content view
- Existing content view
Good to know: For all the metrics in the Report, you can see how they have evolved in relation to the previous year.
Quickly view various metrics, including :
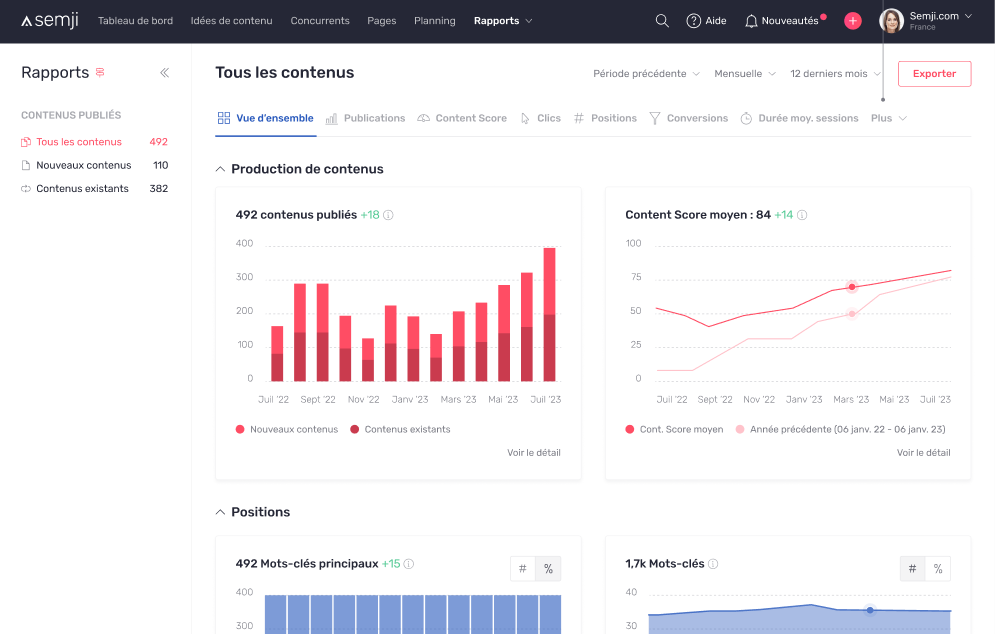
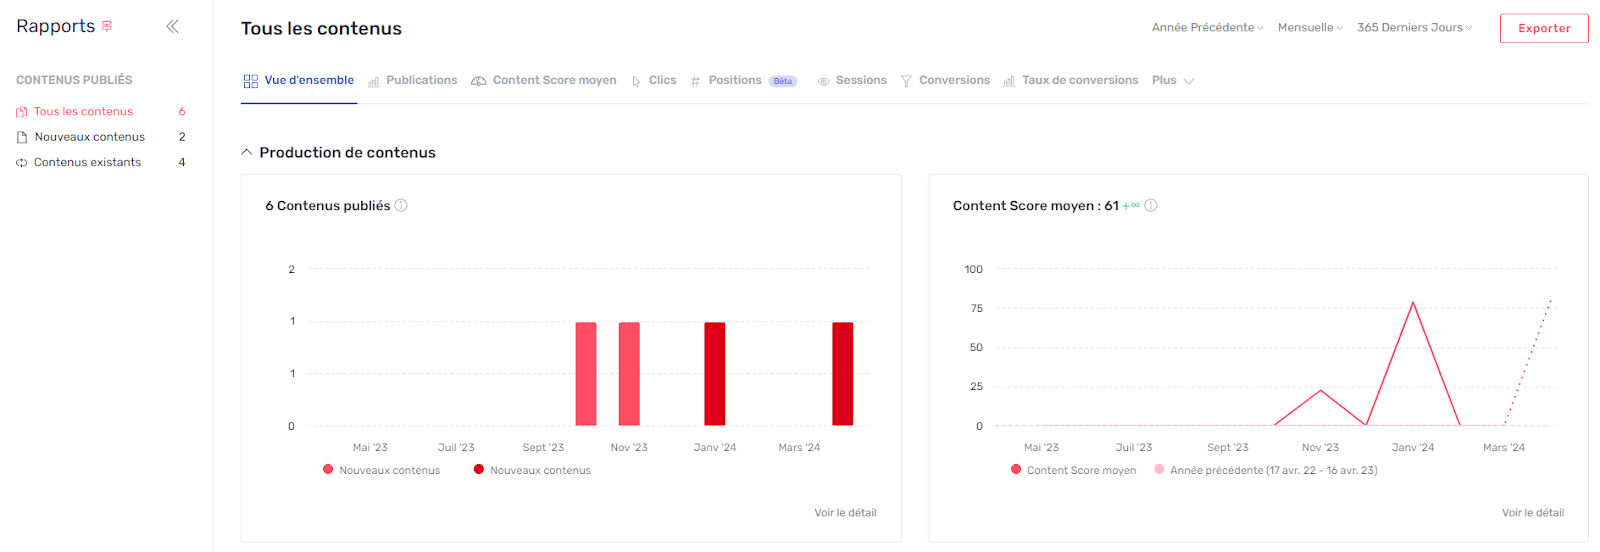
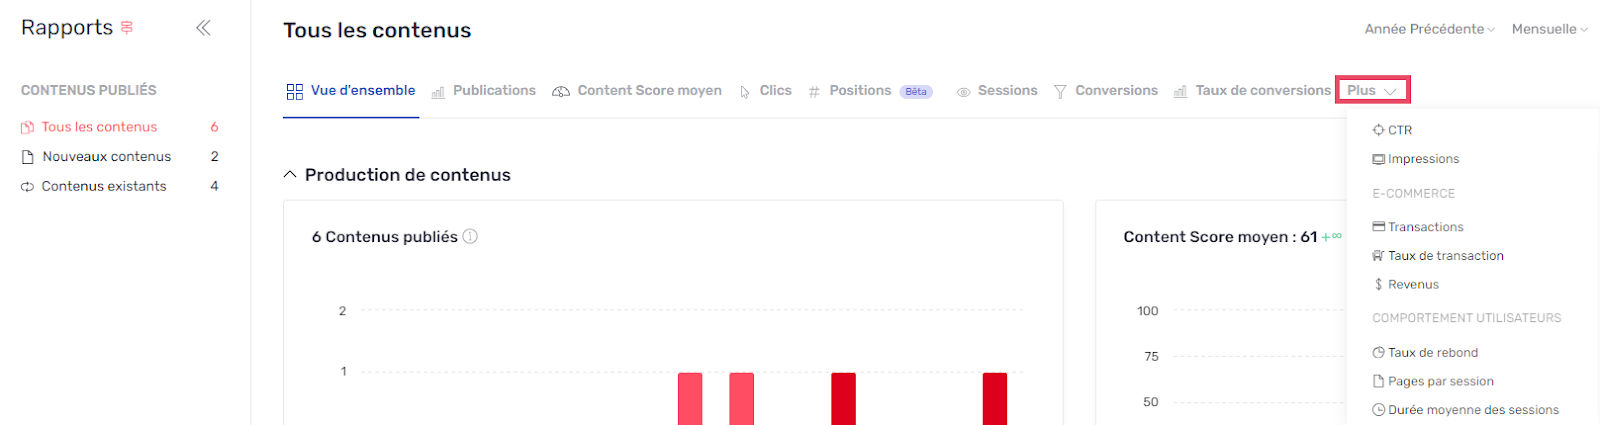
The "Overview" tab: In this view, you can visualize :
- Content production: To visualize content production and observe the average Content Score of your content.
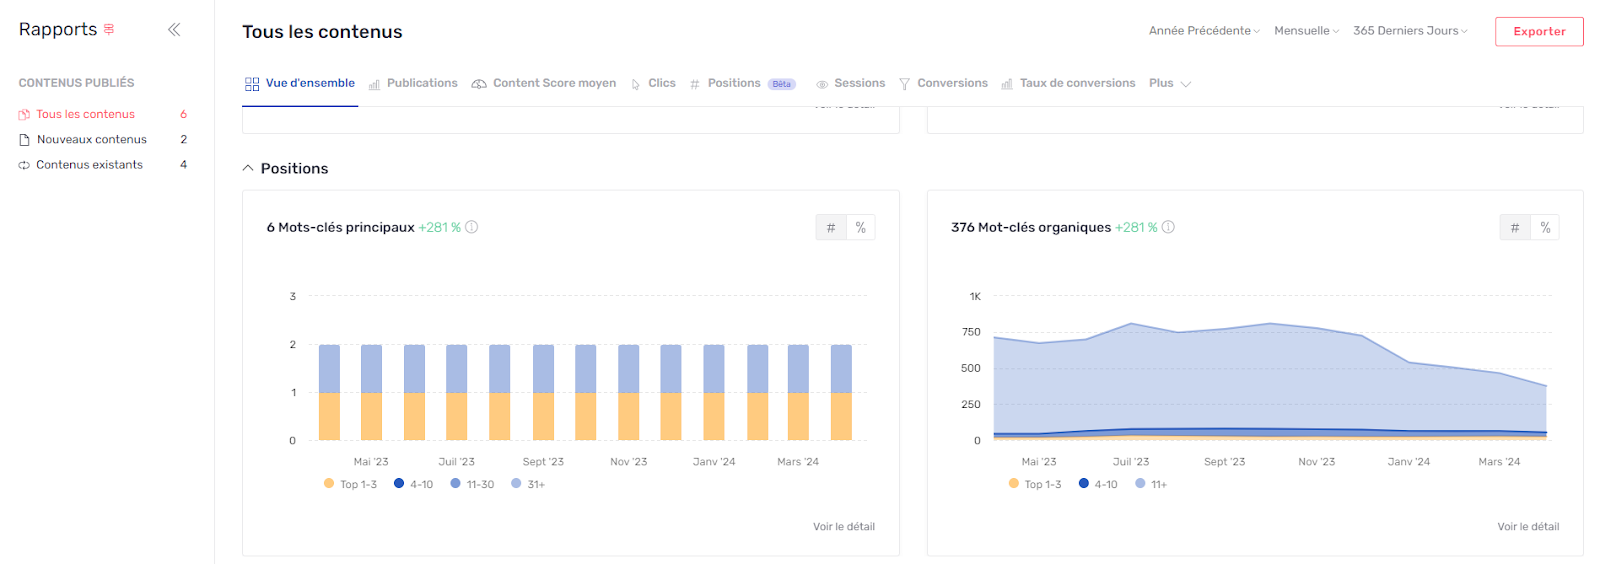
- Positions: Track your gain in main and organic keywords.
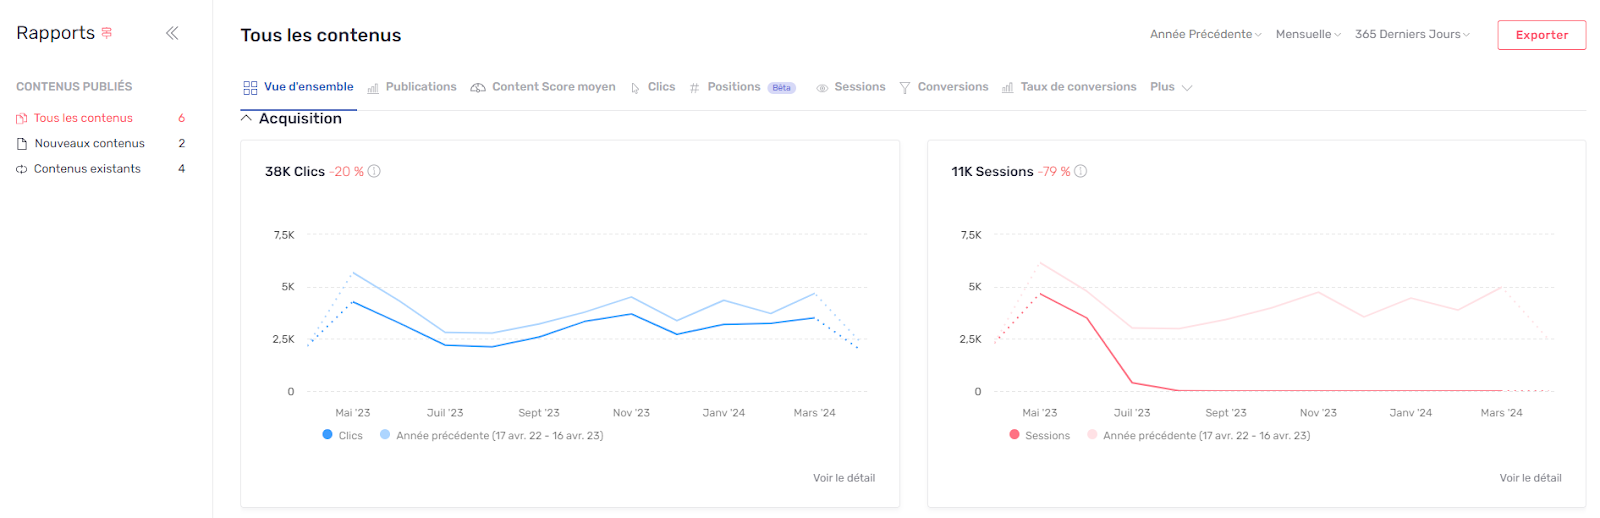
- Acquisitions: To measure the number of clicks, sessions, CTRs (click-through rates) and impressions generated by your content.
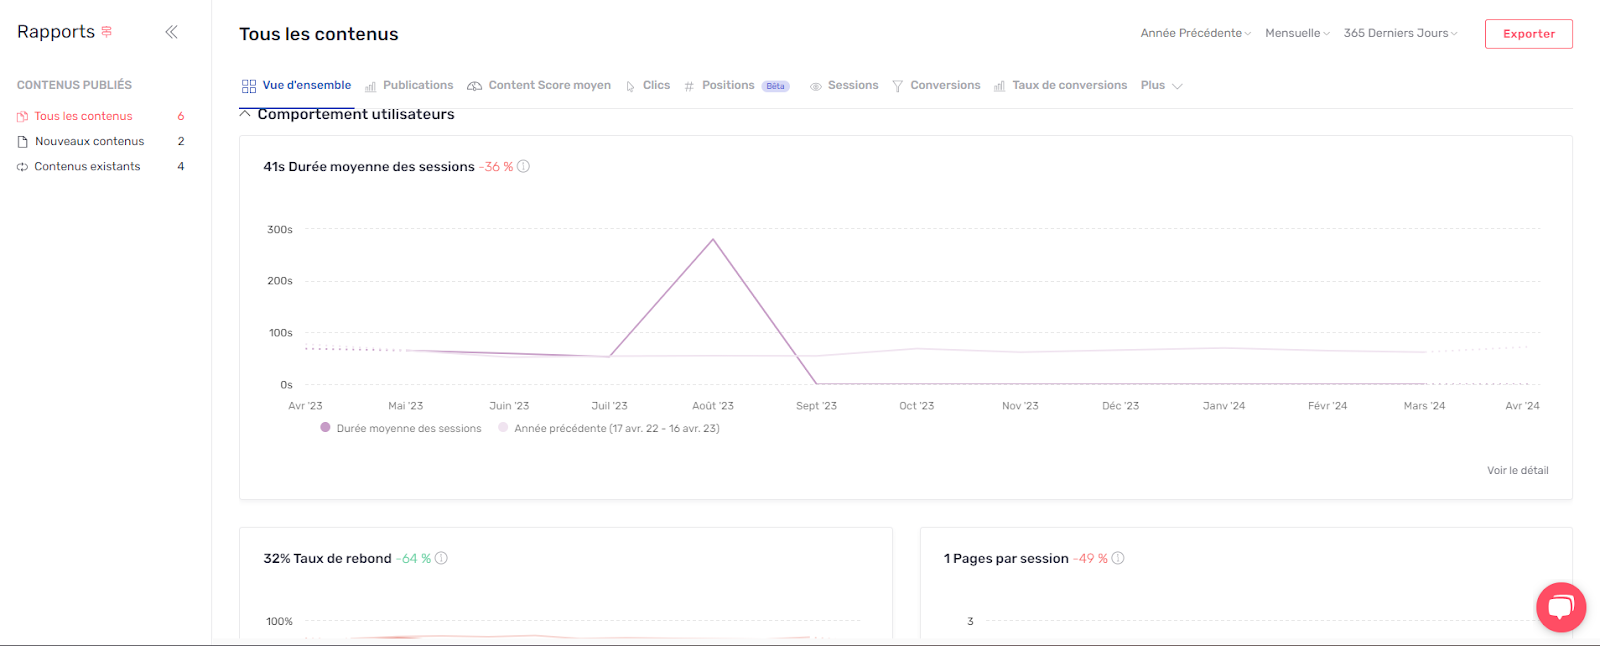
- User behaviors: Identify the average session length, bounce rate and pages per session of your Semji-generated content.
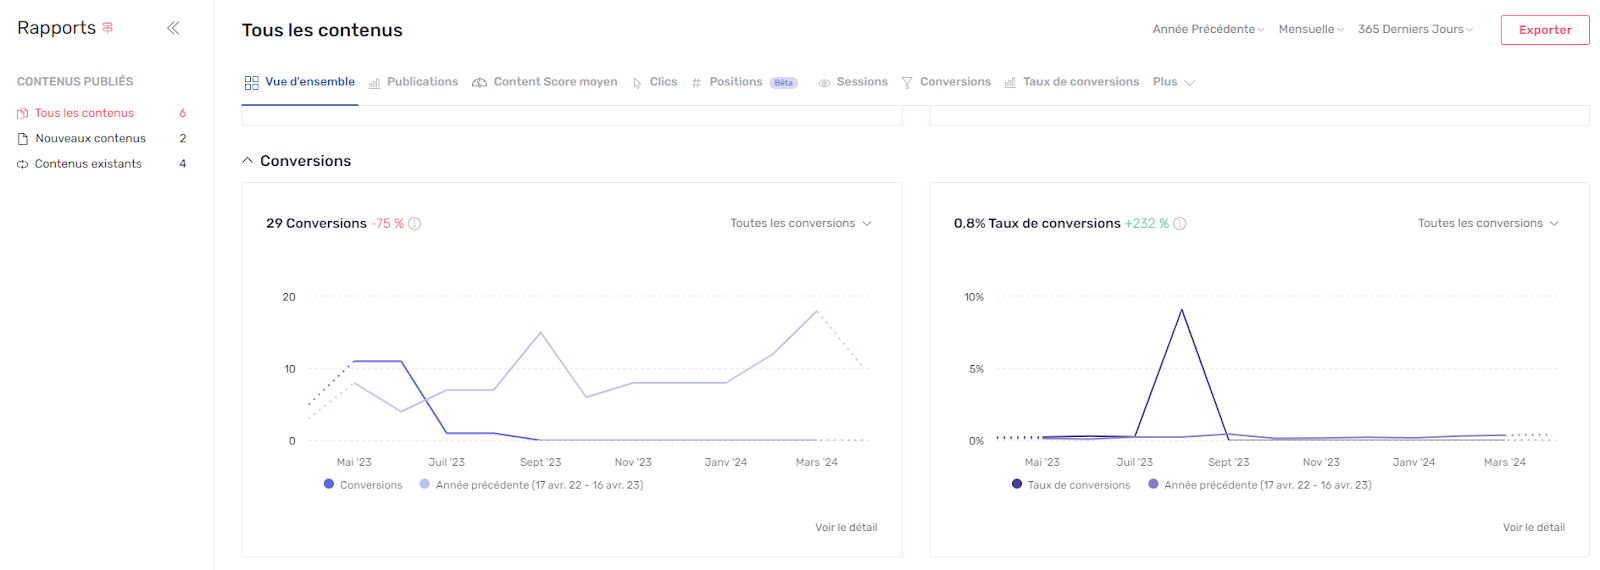
- Conversions and conversion rate generated by your content:
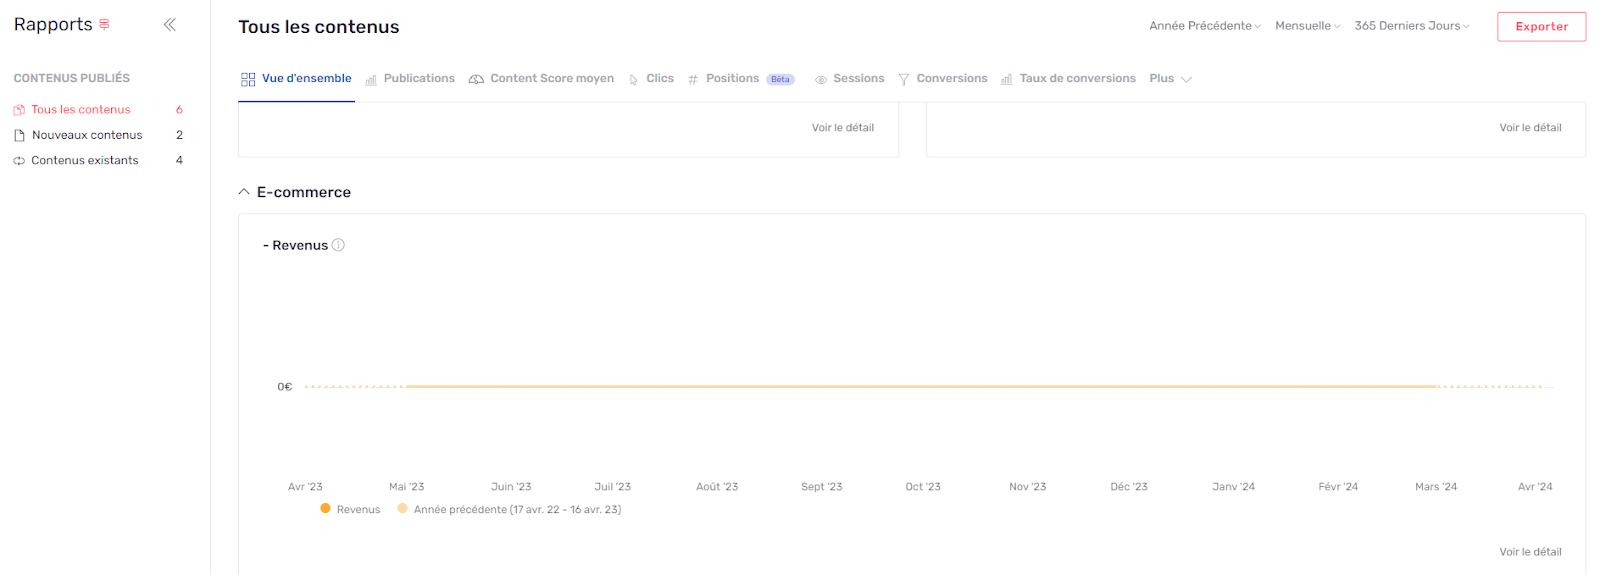
- E-commerce: To detect revenues, transactions and transaction rates generated by your content.
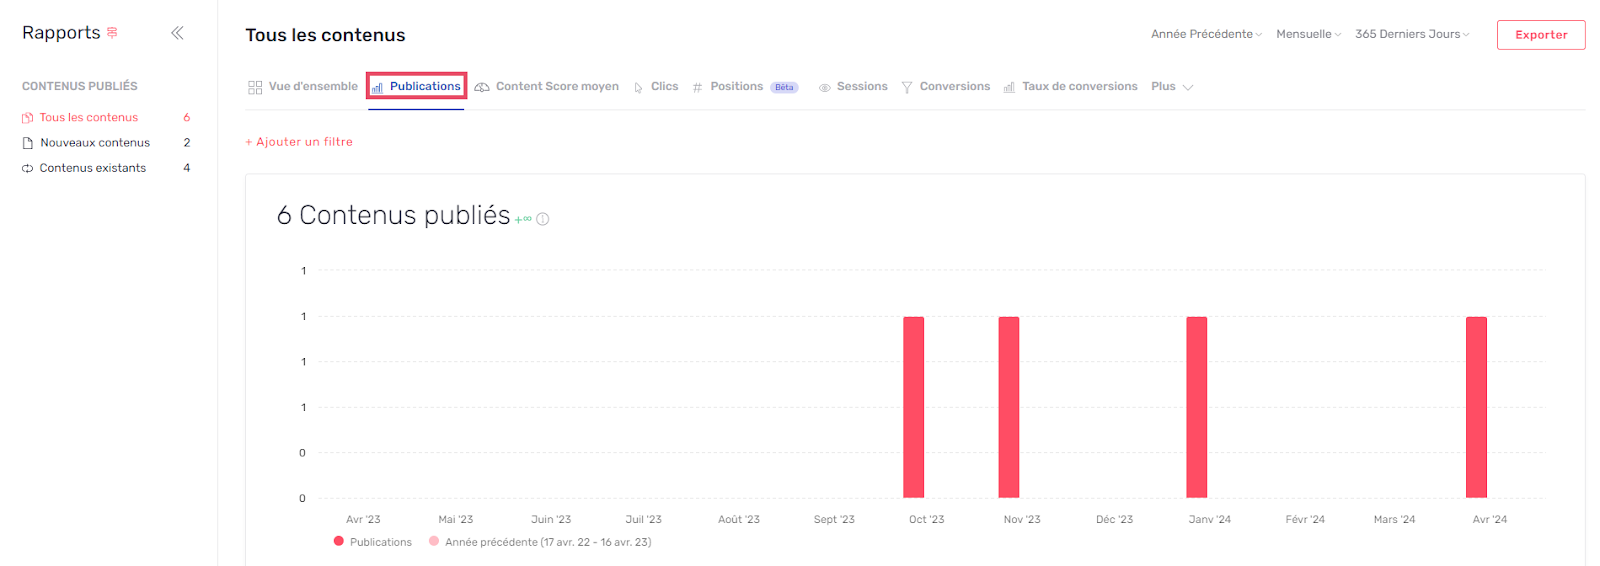
- The "Publications" tab: Depending on the view selected, view content published with Semji
- The "Average Content Score" tab: This data allows you to observe the average content score of your content.
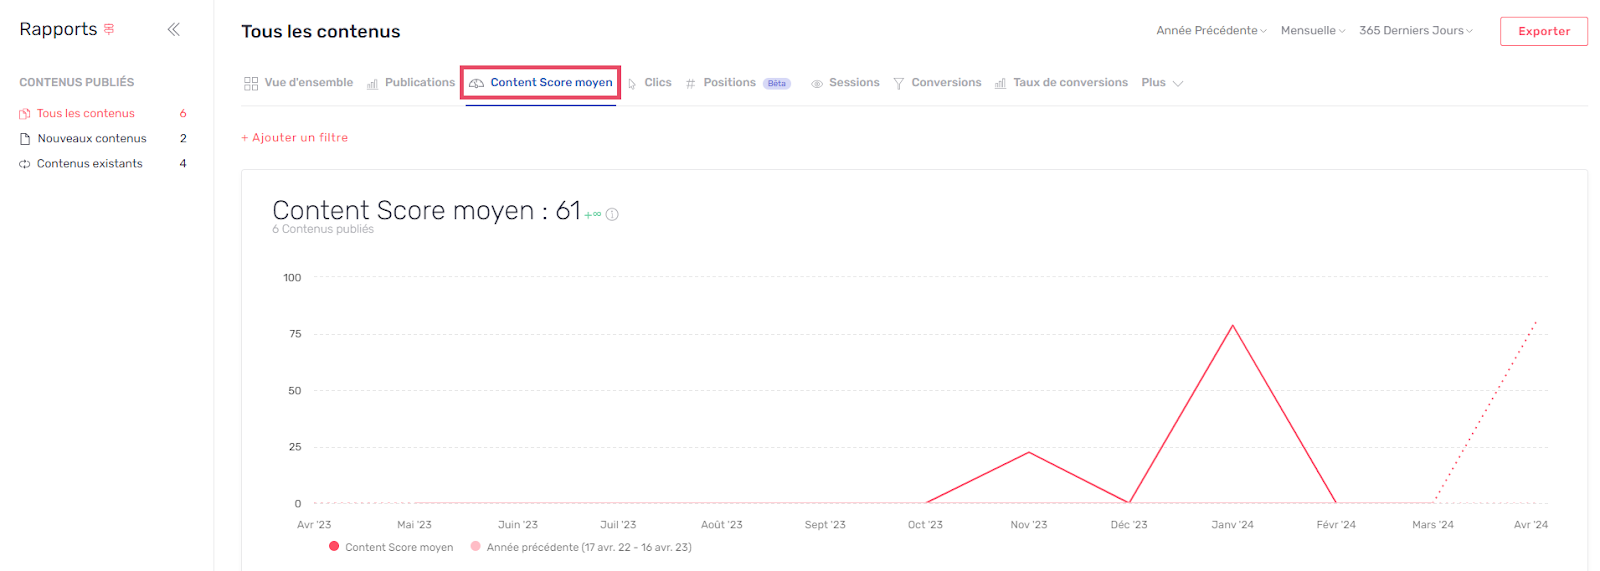
Reminder: We recommend a minimum Content Score of 75 for your content.
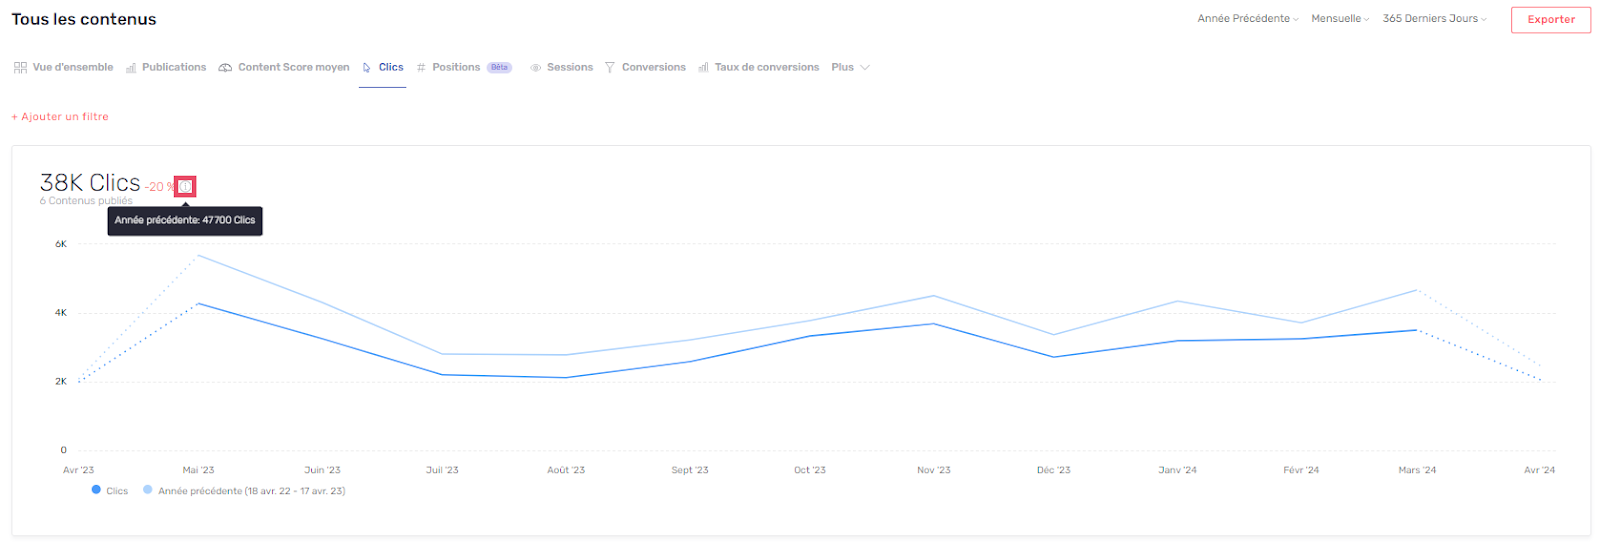
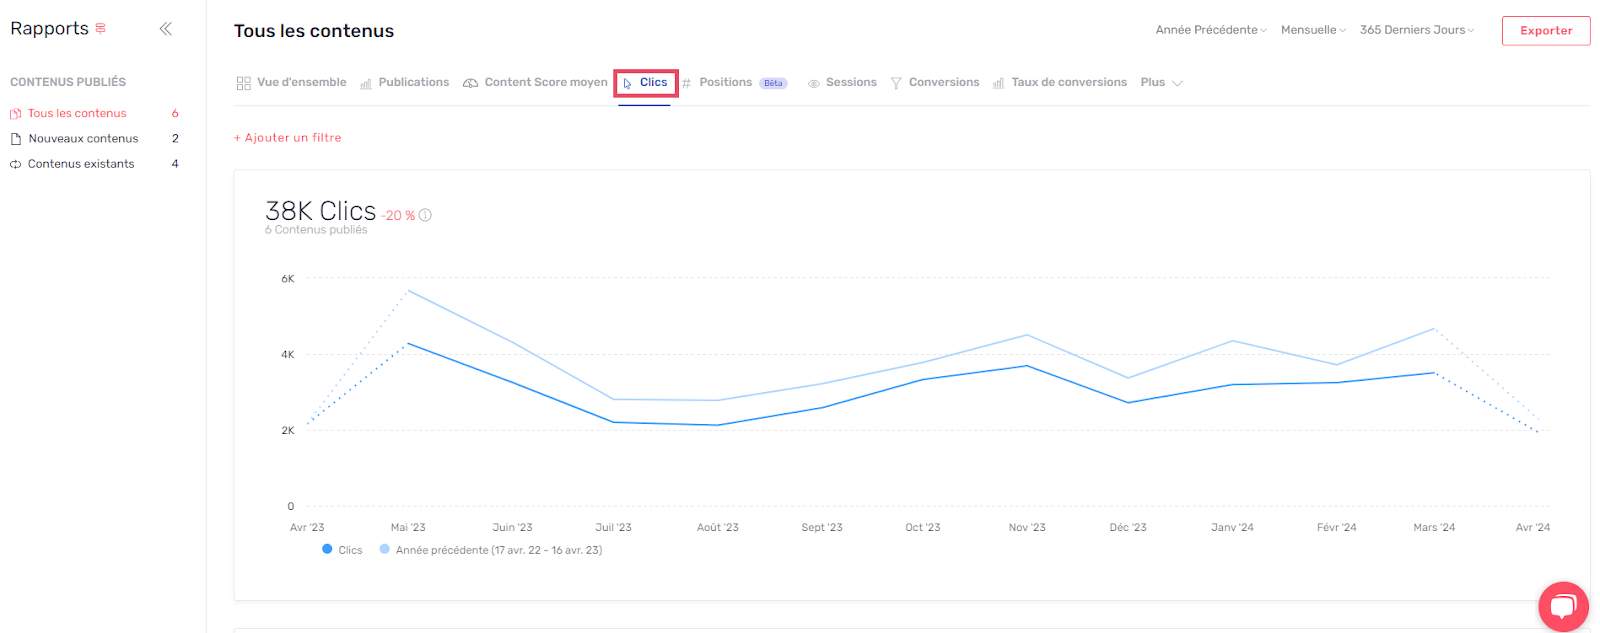
- The "Clicks" tab: shows the total value of clicks over the selected period. When you are in the view you want (overview, existing or new content), it also shows the total value over the chosen period of comparison, as well as the percentage evolution of all content published with Semji.
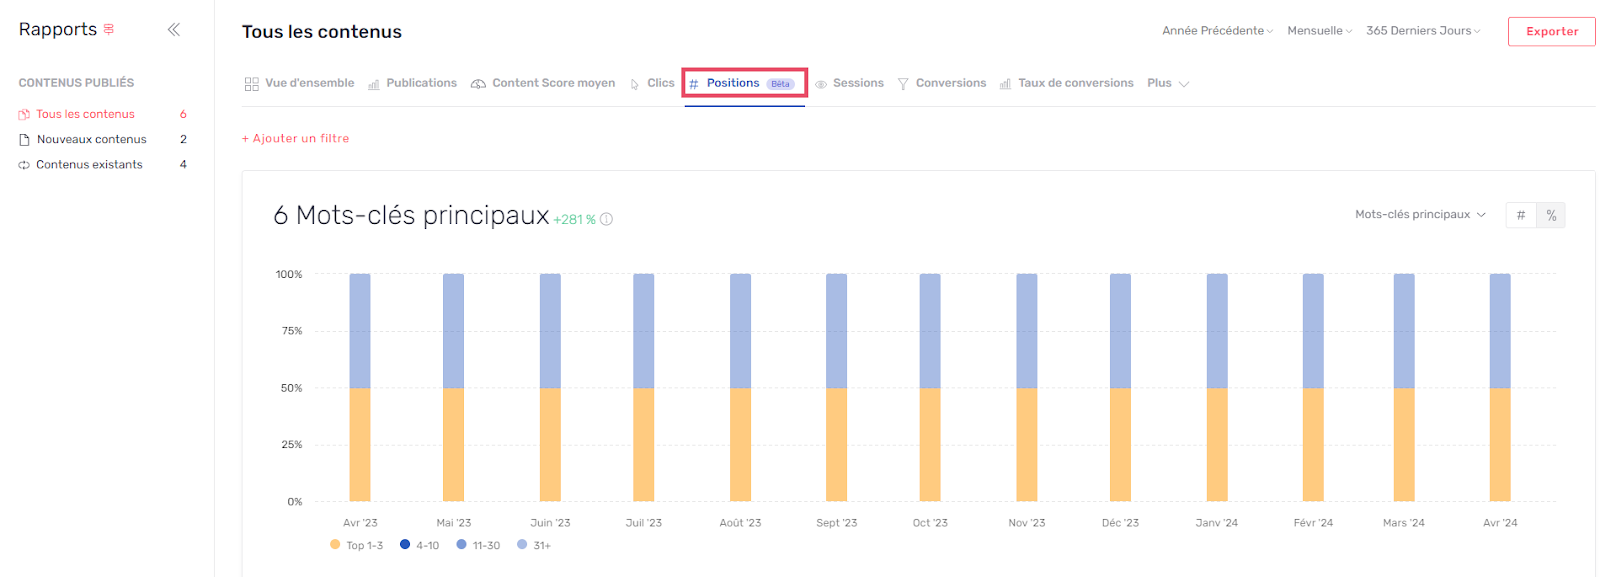
- The "Positions" tab:
Observe your content's position gains on all your strategic keywords in our new Position Tracking module! - Get an overview and history of keyword positions for your content.
- Measure the impact of your SEO actions by comparing your position gains.
- Prioritize your actions by quickly detecting position losses.
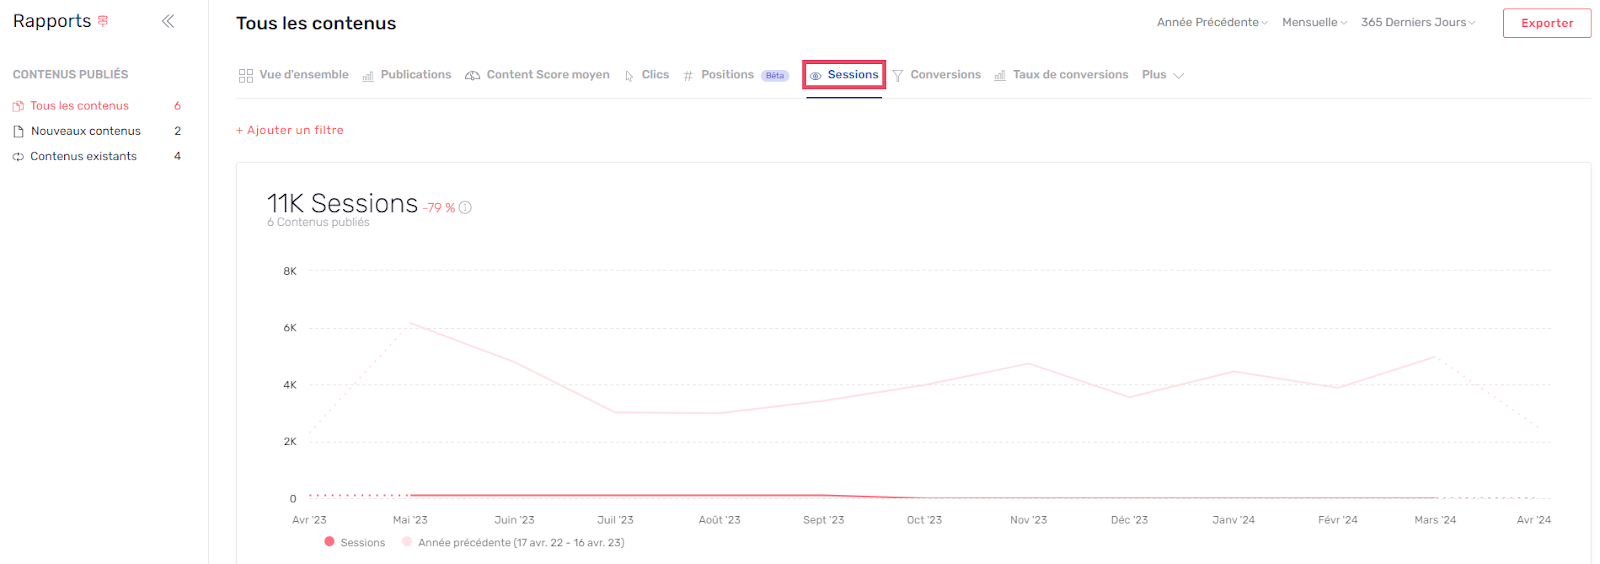
- The "Sessions" tab: Sessions group together all events recorded since the start of a visit to your pages.
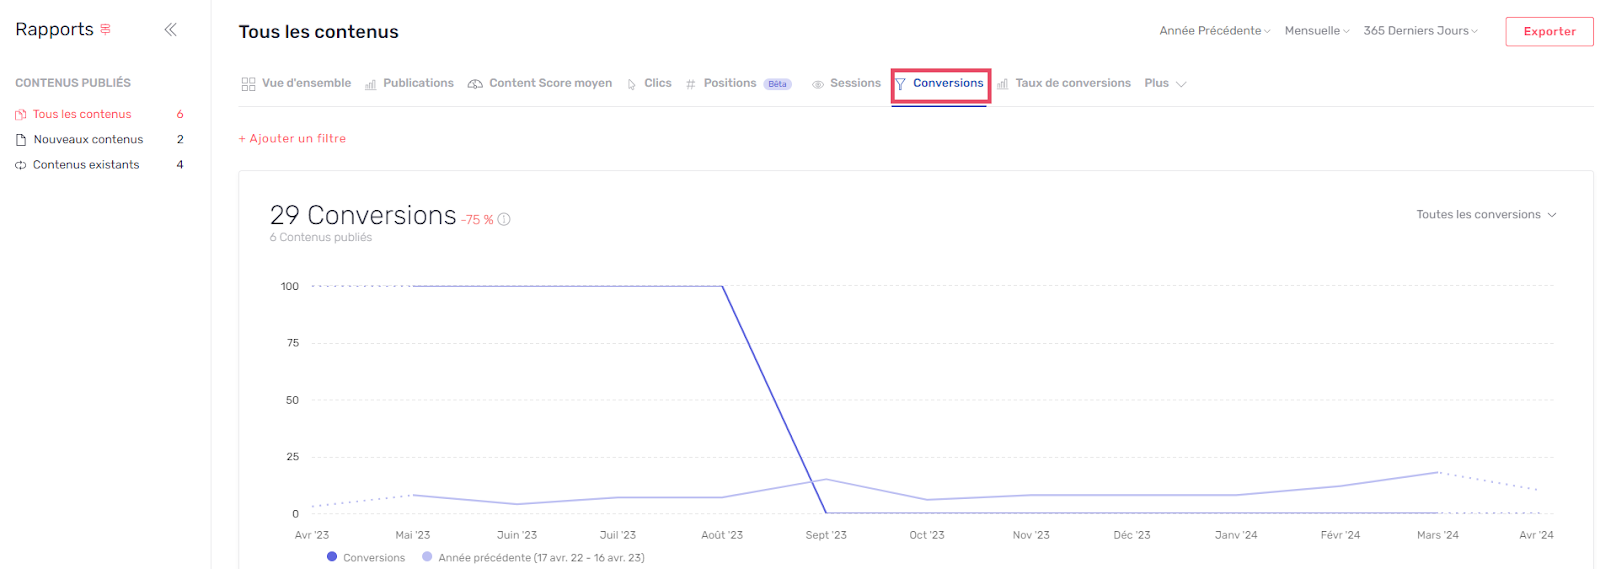
- The "Conversions" tab: in the same way, shows the total value of conversions, and compares it if necessary (on the Existing Content view) with a later period. The result is an evolution rate calculated by Semji.
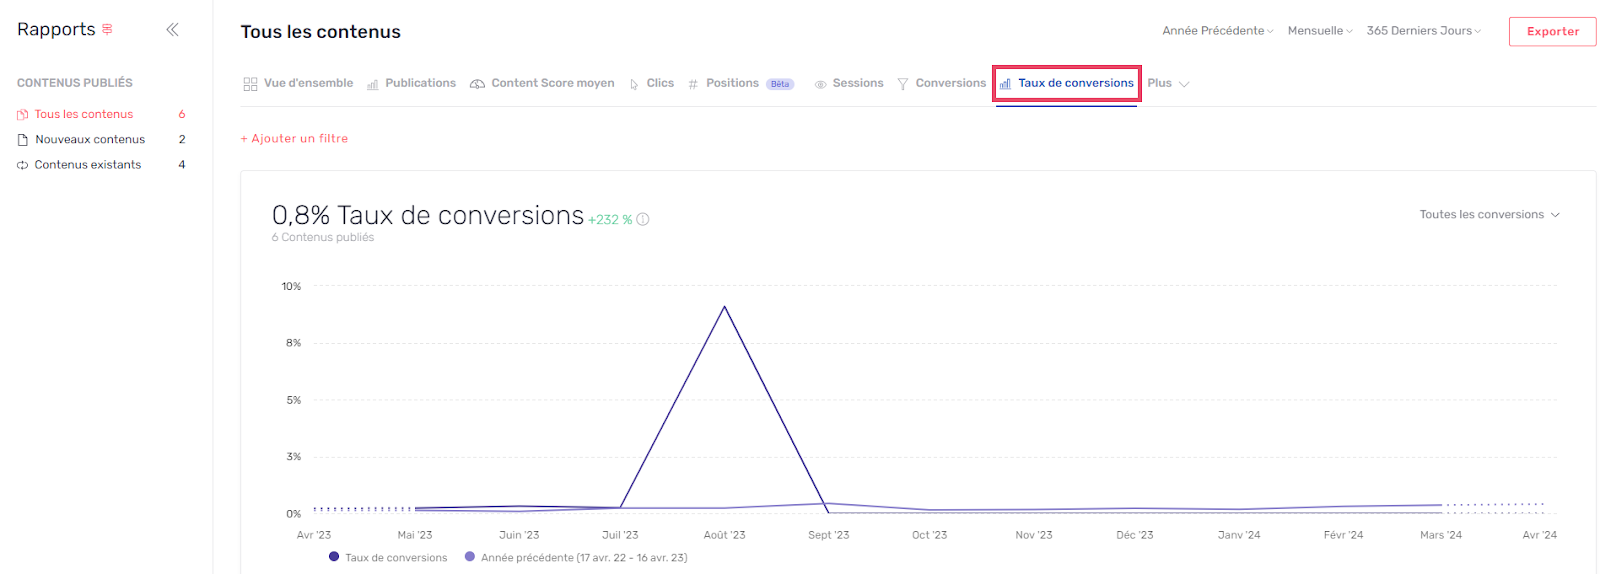
- The "Conversions rate" tab
Once you've connected your web analytics tool, the little arrow to the right of the Conversions or Conversion rates tab allows you to select the objectives you selected when you connected your tool. - "More", to visualize other metrics around acquisitions, e-commerce and user behavior.
On all tabs, get a listing of content and view the associated KPIs.
Content Score: this is the Content Score of the online editorial version, no longer the Content Score of the draft.
Main keyword: this is the main keyword chosen when the published draft was created.
Volume: this is the search volume for the main keyword.
Average position: this is the average position of the page for the main keyword over the last 30 days.
Clicks: Clicks generated by your pages over the last 30 days.
Position: The previous and daily position of your content.
Sessions: sessions generated by your pages over the last 30 days
Conversions: conversions generated by your pages over the last 30 days
Trend: evolution trend of the main keyword according to the selected period.
Last publication: date of the last publication of your content.
Some of these performance indicators evolve according to the tab selected in Report, but also according to the periodicity chosen.
Good to know: you can include filters to customize your Report to your needs.
You can also export your report.
The Reports tab holds no secrets for you!