

 Home
Home Getting Started
 Help Center
 Developer
 Status
At a glance
- What you can do: read your overall AI visibility score and score by LLM platform, track your trends over time, and benchmark your brand against competitors by topic.
- Who it’s for: heads of SEO, content managers, CMOs, and SEO project leads.
- Why it matters: the AI Visibility screen centralizes all your GEO metrics in a single view, from a synthetic score readable by anyone to the full breakdown by brand and topic, with automatic comparison to the previous period.
What changes for you
Before Intelligence Hub GEO, getting a consolidated view of your LLM visibility meant manually querying each tool with no history and no competitive context. Before: no aggregated data, no synthetic KPI, no competitive benchmark on your presence in generative AI. Now: a single dashboard centralizing an AI visibility score readable by any stakeholder, your mention rate, citation rate, their trends over time, and your competitor ranking by topic.Good to know ℹ️: all charts on the AI Visibility screen are clickable. Clicking an element automatically filters the data and switches you to the corresponding view in the Prompts screen.
What you’ll get
The AI Visibility screen is now made up of six graphic widgets and a ranking table.- Visibility Score: a synthetic score from 0 to 100 combining mention rate and citation rate, calculated for you and your competitors.
- Visibility Score by platform: the same score broken down by LLM (ChatGPT, Google AI Overviews…) to identify which model your brand is most or least visible on.
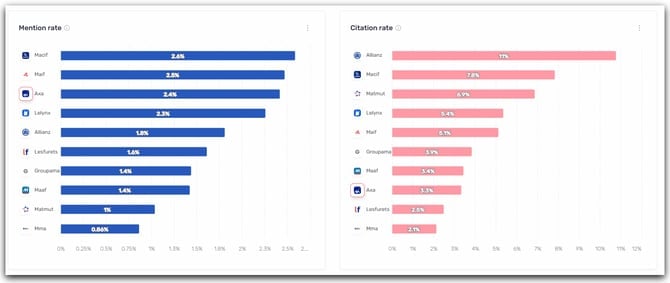
- Mention rate (horizontal bars): the rate at which each brand appears in the text of LLM responses over the period, for you and your competitors.
- Citation rate (horizontal bars): the rate at which each brand’s domain appears in the sources cited by LLMs.
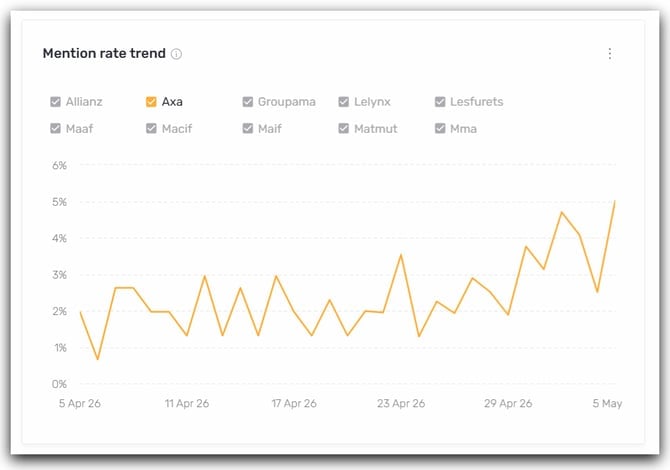
- Mention rate trend (line chart): the day-by-day evolution of the mention rate for all tracked brands over the period.
- Citation rate trend (line chart): the day-by-day evolution of the citation rate for all tracked brands over the period.
- Competitor ranking by topic: the ranking of each brand (#1 to #10) for each configured topic, switchable between the Visibility, Mention, and Citation views. The Visibility view, based on the synthetic score, is shown by default.
How to use it (step by step)
1) Read the Visibility Score
The Visibility Score widget shows a synthetic score from 0 to 100 for each tracked brand. This score combines mention rate (weighted at 65%) and citation rate (weighted at 35%) over the selected period. It’s the most readable KPI for communicating your GEO performance internally: a single number, comparable over time and against competitors, without having to explain how LLMs work. The Visibility Score by platform widget breaks down that same score by LLM.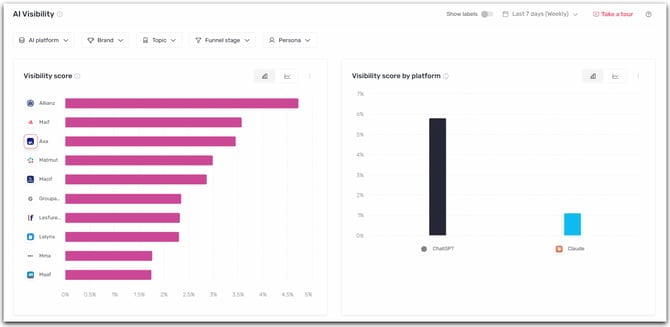
Good to know ℹ️: if no prompts were analyzed in the period, the score displays ”-”. A score of 0 means at least one prompt was analyzed but your brand is neither mentioned nor cited.
2) Read the mention rate and citation rate
The two horizontal bar widgets at the top of the screen give you an instant read of your relative position against competitors over the selected period. Mention rate measures how often your brand appears in the text of LLM responses. If your brand is mentioned in 40 out of 100 queries, your mention rate is 40%. Citation rate measures how often a URL from your domain appears in the sources cited by LLMs. It is independent from the mention rate: a brand can be cited as a source without being mentioned in the text, and vice versa.Good to know ℹ️: these rates are averages calculated across all queries in the period. If your mention rate over 5 days is 4% / 5% / 4% / 0% / 8%, the displayed value will be 4.2%.
3) Analyze trends over time
The two line charts at the bottom of the page let you track the day-by-day evolution of your mention rate and citation rate over the selected period. Each brand is represented by a color. Use the legend checkboxes to show or hide brands and make the chart easier to read.Tip 💡: hold Ctrl (or Cmd on Mac) and click a brand in the legend to isolate a single competitor and focus on its trend.
4) Identify your gaps by topic
The Competitor ranking by topic table at the bottom of the page shows the ranking of each brand from #1 to #10 for each configured topic. Use the Visibility / Mention / Citation toggle in the top right of the table to switch between the three metrics. The Visibility view is shown by default: it ranks competitors on the synthetic score rather than a single metric, so you can see at a glance who dominates each topic and where to focus your efforts. Hover over a competitor’s logo to display their score on that topic. Click a logo to automatically filter the Prompts screen on that topic and that competitor. Click a topic name to go directly to the list of associated prompts.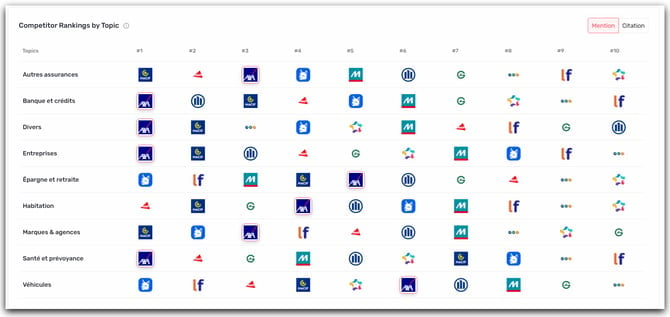
5) Use filters and export
The AI platform, Topic, Persona, and Funnel stage filters at the top of the screen apply to all widgets. Combine them to narrow your analysis to a specific segment. The Show labels toggle (top right) displays values directly on chart bars and data points. Each chart can also be downloaded individually in PNG or SVG format via the menu in the top right of each widget. Use the Export button to extract all screen data in CSV format.Tip ✅: enable Show labels before taking screenshots to produce visuals ready to use without any editing.
Tips for getting the most out of it
Start with the topic ranking. It’s the fastest way to identify which query universes expose you most to competition. Once you’ve spotted priority topics, filter on them to dig deeper in the graphic widgets. Compare both metrics separately. A competitor may have a high mention rate but a low citation rate — meaning they’re often named in responses but their pages aren’t cited as sources. This distinction shapes your content strategy differently. Adjust the period to your goal. A short window (7 to 14 days) reveals recent variations. A longer window (90 days or more) smooths out fluctuations and gives a more reliable baseline trend.Tip 💡: the comparison period is automatic — it always matches the previous period of the same duration. All deltas displayed in the interface reflect this gap.