

 Home
Home Getting Started
 Help Center
 Developer
 Status
In summary
What you can do: Evaluate the effectiveness of your publicationfrequency and the quality of your content using production indicators and Content Score For whom: Content managers and editorial managers who oversee content production and want to optimize their editorial strategy Why it’s useful: Finally answer the question “are our publishing efforts generating the expected results?” with concrete data on your production volume and quality
What it changes for you
You publish regularly, but it’s difficult to know if this pace really pays off. How do you evaluate whether your editorial investment is generating the expected impact? This question often comes up in marketing teams, especially when you need to justify the resources allocated to content production. Semji gives you the keys to objectively measure your editorial performance. Thanks to integrated production and quality indicators, you have a clear vision: publication volume, SEO quality evolution, and correlation with your traffic performance. Concrete result: you optimize your editorial calendar based on factual data and easily demonstrate the value of your editorial work.Analyze your content production and quality
Step 1: Analyze publication volume
First step: understand your production rhythm. The “Content Production” graph reveals two essential pieces of information about your editorial activity. New content vs Existing content: This distinction is fundamental for analyzing your strategy. “New content” represents your fresh creations - blog articles, new product pages, original guides. “Existing content” corresponds to your optimization efforts - updates to performing articles, enrichment of existing pages, SEO corrections. Why this metric is strategic: It allows you to identify your periods of high editorial activity and correlate this intensity with your traffic performance a few weeks later. You can thus validate whether your production peaks actually generate measurable results. Our recommendation: Aim for a balance between creating new content (to target new queries) and optimizing existing content (to maximize the potential of your already indexed pages). A 50/50 ratio often constitutes a good starting point.Step 2: Track average quality with the Content Score
Second step: evaluate the SEO quality of your publications. The “Average Content Score” graph acts as your quality barometer, indicating whether your content follows SEO optimization best practices. Understanding the Content Score: This Semji metric evaluates the technical and semantic quality of your content on a scale of 0 to 100. It takes into account your heading structure, semantic richness, keyword optimization, and completeness relative to search engine expectations.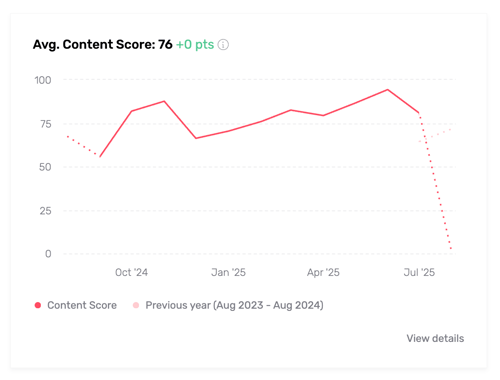
Good to know:
Reference thresholds:
Our recommendation: aim for a minimum Content Score of 75 to ensure the performance of your content. This threshold constitutes the best practice expected to maximize your chances of ranking and organic traffic.
- Score > 80: Excellent optimization, your content has strong performance potential
- Score 75-80: Expected performance threshold, your content is well optimized
- Score 60-75: Additional optimizations recommended to reach optimal performance level
- Score < 60: Significant room for improvement, focus on training recommended
Use case: Correlating production and performance
Concrete scenario: You published 15 new articles in September with an average Content Score of 75. How do you measure the impact of this effort on your SEO performance? Analysis Method:- Isolate the production period: Use the date filter to select September and note your production peak.
- Analyze the delayed impact: Shift your analysis by 4-8 weeks (usual Google indexing and ranking delay) to measure the impact on your organic clicks and sessions.
- Segment by quality: Compare the performance of content with a Content Score > 80 versus those < 60 to validate the importance of quality.
Optimize your editorial strategy
You now have the key indicators to effectively manage your content production. The intersection of publishing volume and Content Score helps you identify the sweet spot between quantity and quality that maximizes your performance Our recommendation: Start by analyzing your last 3 months of production to identify your performance patterns. Use these insights to adjust your editorial calendar and quality standards. Next step: Once your production is optimized, analyze how your content performs specifically on Google to identify your priority SEO opportunities. ➡️ Guide 2: Analyze your SEO performance on GoogleTrack your positions, clicks and optimize your organic visibility