The Reports tab allows you to easily track your production efforts and the performance of your content in one place.
Table of contents :
Why is it important to monitor / track performance gains?
Why are the performances organized in two separate views: New Content and Updated Content?
How is the Reports tab organized?
How to see the performance of a content in detail?
How to export data from the Reports tab ?
|
Free trial |
Custom Legacy |
Basic |
Business |
Unlimited |
|
✅ |
✅ |
✅ |
✅ |
✅ |
Video summary
Why is it important to monitor / track performance gains?
Monitoring your performance gains is essential in an SEO strategy for several reasons :
- To value the work and involvement of your editorial team.
- Implement a continuous improvement process by analyzing and understanding what worked and what didn't.
- Identify good and bad practices, re-challenge your objectives and reorient your strategy globally.
- Calculate the return on investment by comparing the cost of the editorial effort with the traffic and leads generated.
Why are the performances organized in two separate views: New Content and Updated Content?
Updated content offers the opportunity to cross-reference and compare current data with previous data that Semji has retrieved from your Google Analytics and Search Console accounts.
New content, on the other hand, starts from scratch and therefore cannot benefit from this comparison because no previous data has been recorded.
These two values can neither be combined nor added together. A global evolution rate would be distorted because it is based solely on the performance of updated content. Since Semji is committed to providing you with a macro view and allowing for its interpretation, it was important to separate the two values into two distinct views.
How is the Reports tab organized?
The report settings bar

At the top left of the page you will find the report settings bar. This bar allows you to customize and set the display of the Reports tab globally. Whether you are on one or the other view, the display is the same.
On this bar, you can click on "Add a filter" to add a filter to customize the report according to certain elements. These will be coupled with the basic indicators to provide you with more accurate reports. 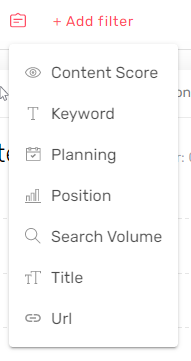
For example, by filtering on the "Content Score", you can look at the performance of all content that has been published with a content score higher than 75.
By filtering on the "Focus Keyword", you can analyze the progression of the contents worked on a semantic cocoon whose focus keywords are close. Finally, by filtering on the URL you can isolate the performance of a certain category of page or a directory of your site (blog/category/article...).
On the same bar, you can select different analysis periods and the granularity of the report. You can compare your data with previous data, display a shorter period of data or smooth the data to facilitate the analysis of its trend.
Good to know : We advise you to compare your data with the previous year rather than with the previous period to be able to take into account seasonality logics (Black Friday, trade shows...). For example, it is better to compare your performance in November 2021 with November 2020, i.e. the previous year, rather than comparing it with October 2021, i.e. the previous month.
Depending on the subscription plan you have, you will have access to a longer or shorter data history. For the old Starter and Pro plans, the data history stored by Semji is 13 months while for the Custom plans it is 24 months.
The main KPIs selection menu
Then there is the main KPIs selection menu with its different tabs (general view, clicks, conversions and revenues) which each correspond to a production or performance indicator.
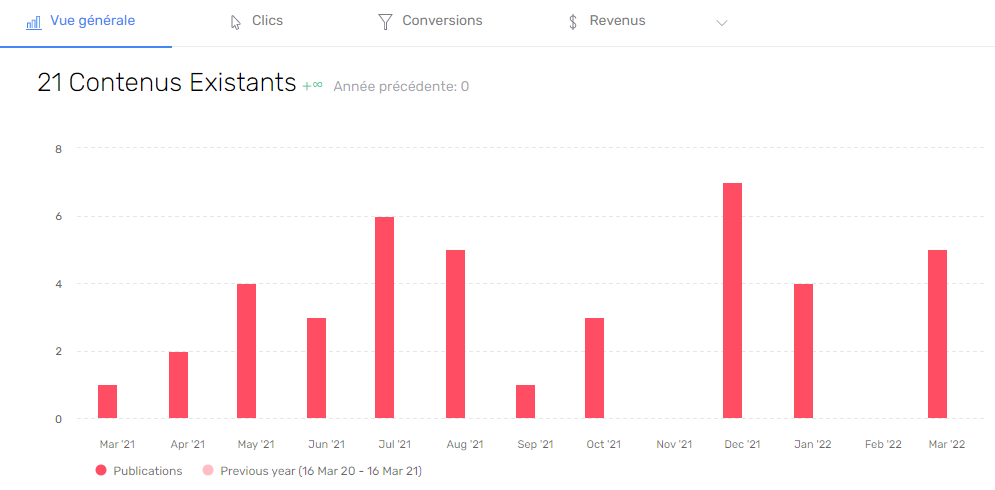
The production indicator: the overview tab
First we find the overview tab, the only production KPI. It shows you the temporal distribution of publications, i.e. how much content (new or updated, depending on your view) has been published and the month of publication.
Performance indicators: the Clicks, Conversions and Revenues tabs (and many others!
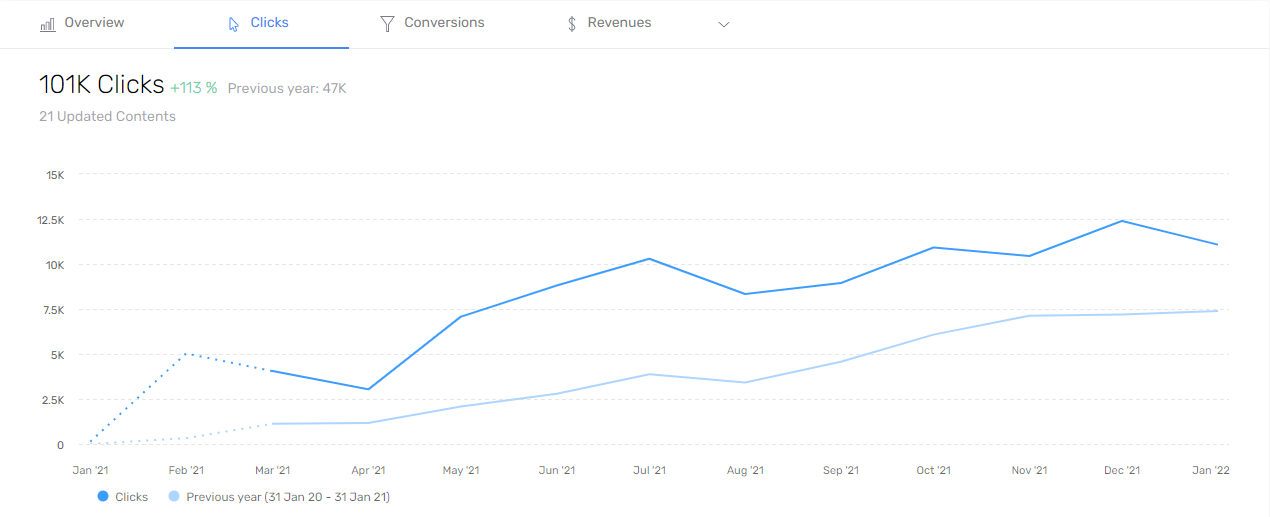
The Clicks tab shows the total value of clicks over the selected period. When you are in the Updated Content view, it also shows the total value of clicks over the selected comparison period as well as the percentage of evolution of all updated content published with Semji.
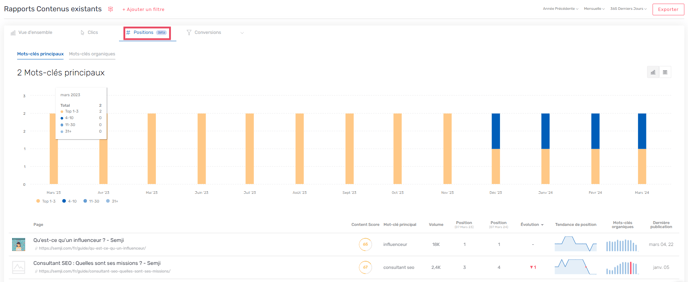
The Positions tab: observe your content's position gains on all your strategic keywords in our new Position module!
- Get an overview and history of keyword positions for your content.
- Measure the impact of your SEO actions by comparing your position gains.
- Prioritize your actions by quickly detecting position losses.*
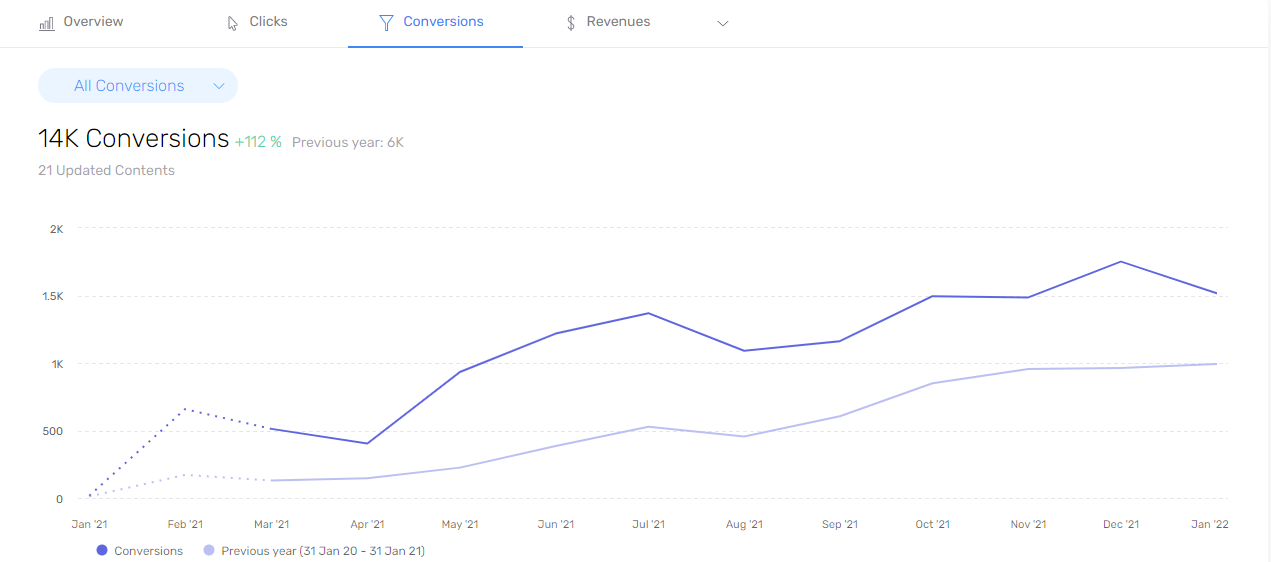
The Conversions tab similarly shows the total value of conversions, and possibly compares it (in the Updated Content view) with a later period. The result is an evolution rate calculated by Semji.
The Revenue tab works in the same way, showing you the revenue generated by your content published with Semji - as long as this data is known and can be retrieved from your Google Analytics or AT Internet account. From the Updated Content view, you can compare this revenue performance to a previous period.
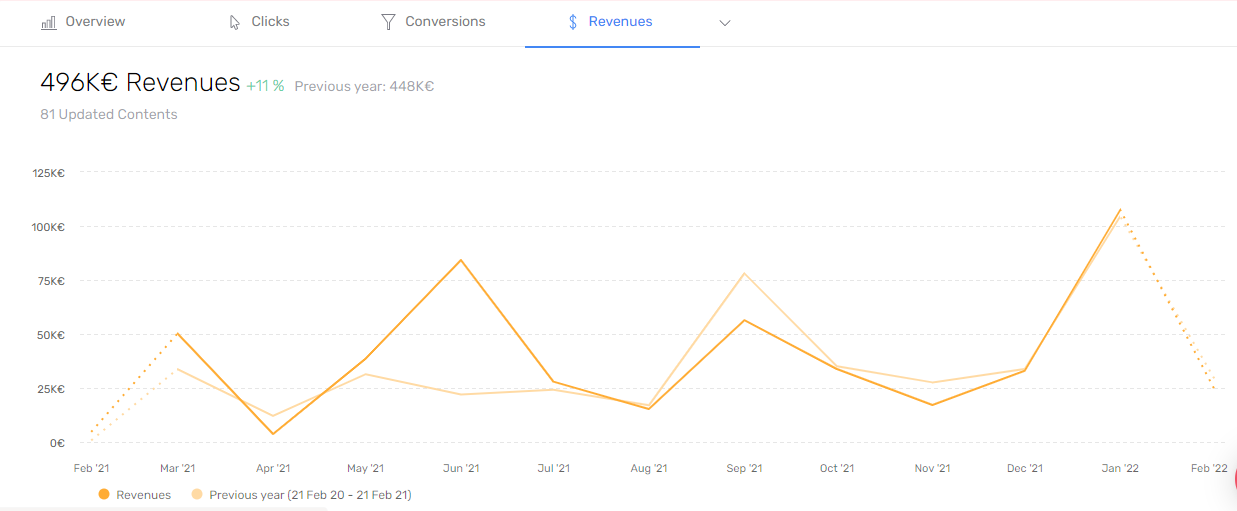
Once you have linked Google Analytics or AT Internet (its possible alternative with Semji), the little arrow on the right of the Revenues tab allows you to select a multitude of other KPIs.

Selecting a particular KPI - either from the 3 favorite tabs Clicks, Conversions, Revenues, or from the KPIs in the drop-down menu - displays the data for that KPI in detail for each content in the bottom table. This also customizes the macro curve overall.
Good to know : The main macro curve also called global curve is actually a cumulative curve of all the data of the contents published with Semji over the defined period.
The table detailing the performance of each content
By scrolling within your Reports tab, you'll be taken to a table that provides a detailed view of all content reported as published. Whether you are on the New Content or Updated Content tab, the same layout is applied.

On the right side of the table, you can see all the KPIs you have access to with Semji. Some of these indicators are fixed regardless of the selected filters:
- The Content Score : here it is the Content Score of the online editorial version, it is no longer the Content Score of the draft.
- The Focus Keyword : this is the main keyword chosen when the draft was created and published.
- The position : this is the average position of the page on the focus keyword over the last 30 days.
- Volume : this is the search volume for the focus keyword.
Some of these performance indicators evolve according to the main indicator chosen by means of the tabs of the upper macro graph: clicks, conversions, revenues, but also those of the drop-down menu.
When you select Clicks by displaying the global view of this indicator on the top graph, the table detailing the contents displays the total clicks generated by each URL over the last 30 days, the increase in clicks compared to last year (or the previous period) and the rate of evolution that this generates. The same behavior and data periods are duplicated for each other KPI.

Conversions: display up to 3 separate goals
Semji offers a little subtlety for the Conversions tab with an additional view. When logging into your Google Analytics or AT Internet account, you could add up to 3 specific conversion goals (for example, conversions related to a sign-up button, a quote request or a shopping cart). These conversions added in Semji appear on the macro chart and allow you to filter the chart and the lower table on one of them in particular.
How to see the performance of a content in detail?
From the Reports tab, click on one of the content listed in the table. You will then open the visualization of this content in Semji and find yourself on its "Performance" tab.
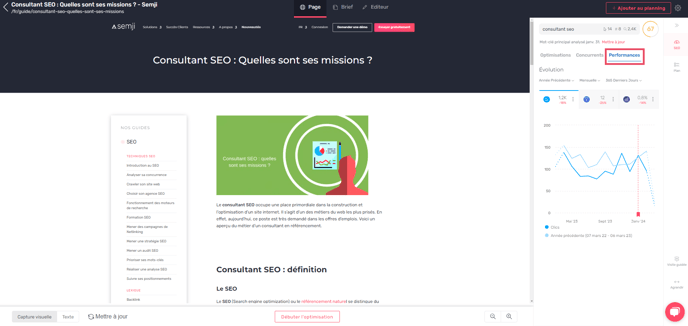
This Performance tab allows you to select the KPI you wish to view in detail on the graph, in the same way as the global cumulative graph.
In the case of updated content, Semji retrieves previous data if they exist in your Google Analytics (or AT Internet) and Search Console accounts, so as to display the historical data and allow you to compare with the performance that follows the optimization of the content.
You can easily see the date the content was published, marked with a pink dot. If you optimize this content several times during the year and click "mark as published" several times, several pink dots appear on the curve.
For this content in detail, you can also change the comparison period, granularity and data display period.

How to export data from the Reports tab?
Semji allows you to export your performance data directly from the Report tab, to use it outside the platform (in an Excel file for example). Go to the sub-tab "New Contents" or "Existing Contents" and click on the "Export" button.![]()
You can then export your data in two different formats: Excel or CSV.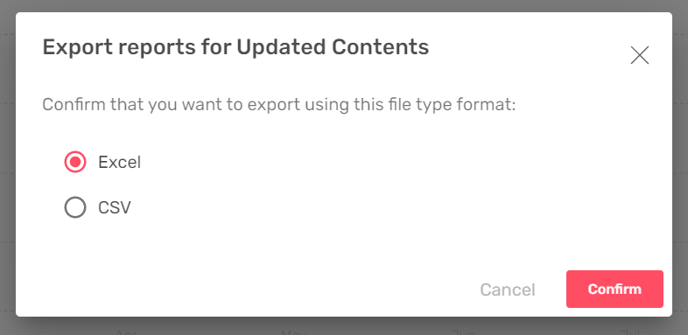
Select a format and confirm. The export will then be saved in your downloads folder. If the file is too large, it will be sent to you by email automatically.
Note: Exports are contextual, meaning they are customized based on any filters you apply to your view. You can filter by clicks, conversions or revenue and use the desired breakdown level. You can also filter by folder to analyze the performance of a specific folder for example.